
Essential lab tests, red flag patterns, and strategies that decoded 30 years of medical mystery
The Power of Strategic Lab Analysis
In 2025, I asked AI a simple question about why my GLP-1 therapy wasn’t working. Within minutes, it identified critical patterns in “normal” lab results that had been overlooked for years – not because the technology was magic, but because I finally had a systematic approach to analyzing the complete picture. This page gives you that same strategic framework for understanding your labs, identifying patterns, and working effectively with your healthcare team.
Important: Reference ranges vary between labs. All ranges here are from my reports and my labs. Always use your lab’s specific ranges and focus on patterns rather than exact numbers.
What’s Covered in This Guide
Part 1: Strategic Lab Testing Framework
Start with Foundation Screening
Rather than jumping to specialized tests, build your case systematically. These foundational panels work for most health concerns and are easily approved by most doctors. Use your results to justify more targeted testing based on your specific symptoms and patterns.
Universal First-Line Screening:
- Complete Metabolic Panel (CMP) – glucose, electrolytes, kidney/liver function
- Lipid Panel – cardiovascular and metabolic health indicators
- Complete Blood Count (CBC) – infection, anemia, basic inflammation
- Thyroid Panel – TSH, Free T4, Free T3 minimum (energy, metabolism, temperature regulation)
- Vitamin D 25-OH – immune function, bone health, mood
What These Reveal:
- Metabolic dysfunction patterns (glucose trends, lipid ratios)
- Organ function status (kidney, liver)
- Inflammatory indicators (white blood cell patterns)
- Energy-related hormone status (thyroid basics)
- Common nutrient deficiencies
My Specific Focus Areas
Match your symptoms to relevant testing categories. Based on my symptoms (chronic fatigue, weight resistance, brain fog), I prioritized these areas:
Adrenal Function (for unexplained fatigue, stress intolerance)
Understanding Cortisol Testing Types:
Here’s the thing about cortisol testing – there are several different ways to measure it, and each tells a slightly different story.
- Serum Free Cortisol: The gold standard for diagnosis is serum free cortisol, which measures the bioactive hormone that’s not bound to proteins – essentially what’s actually available for your cells to use.
- Saliva Cortisol: reflects those same free cortisol levels and is excellent for assessing your daily rhythm. It’s scientifically valid³, but many conventional doctors still dismiss it, which is frustrating when you’re trying to get help.
- Total Serum Cortisol: Includes protein-bound (inactive) cortisol, less clinically useful
- 24-hour Urine Cortisol: Good for detecting excess cortisol (like in Cushing’s syndrome), but less sensitive for catching deficiency
My Experience:
I had low saliva cortisol for years starting in 2009 and was diagnosed with “adrenal fatigue,” but that condition isn’t recognized as a legitimate diagnosis by conventional medicine. It wasn’t until serum free cortisol confirmed the same pattern that conventional medicine took it seriously and I received proper adrenal insufficiency treatment.
For morning cortisol testing, timing is everything. The reference ranges are completely different depending on when your blood is drawn – morning collections should be between 8-10am for the range of 0.21-1.04 µg/dL, while afternoon collections (4-6pm) have a lower range of 0.10-0.63 µg/dL. This is where lab systems often fail patients – they don’t always correlate collection time with the appropriate reference range.
My Red Flag Pattern:
- 2023: 0.09 µg/dL at 11:45am (67% below normal)
- 2024: 0.19 µg/dL at 10:40am (still low)
The below chart shows free cortisol levels remaining severely low (below 0.2 μg/dL) despite major life stressors like unemployment and family health crises, demonstrating adrenal insufficiency where cortisol failed to rise appropriately in response to stress.
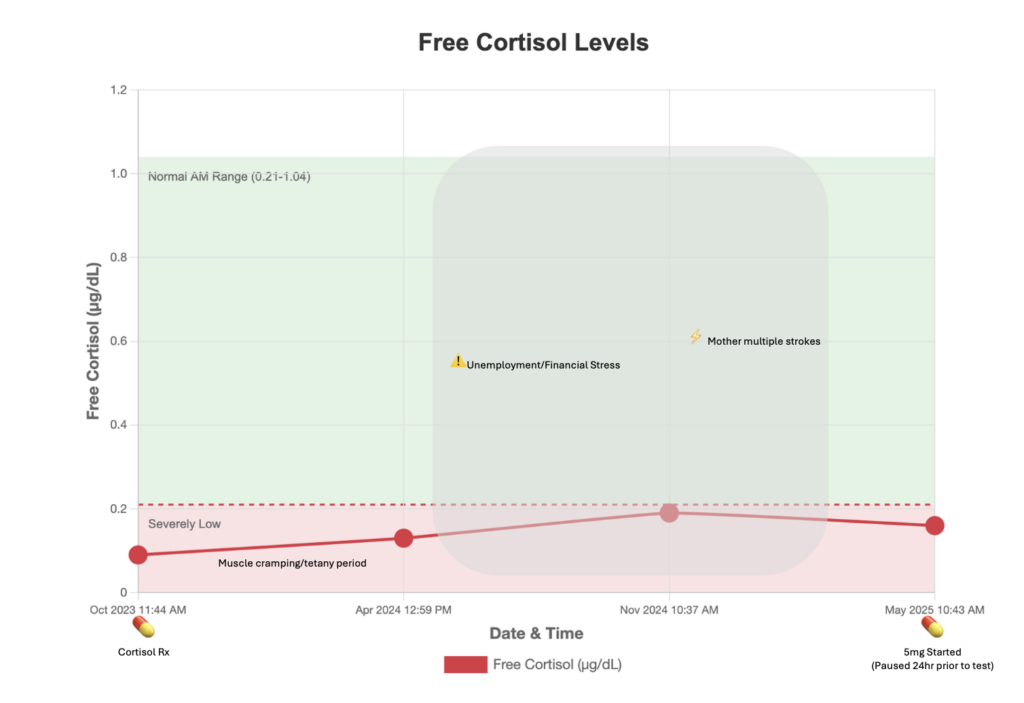
Why This Mattered: These values were severely low by any standard – even the more lenient afternoon range starts at 0.10 µg/dL. My morning values should have been 2-10x higher than what was measured.
Thyroid Function (for fatigue, brain fog, temperature issues, hair loss)
This is where I learned that conventional medicine has a significant gap. Most doctors stop at TSH and think they’ve done a complete thyroid workup. But TSH only tells you what your pituitary is doing – it doesn’t tell you whether your body is actually converting T4 into the active T3 hormone, or whether you’re making too much reverse T3 (the “brake pedal” hormone that blocks T3).
Just because your TSH looks normal doesn’t mean your thyroid function is optimal. I had “normal” TSH for years while feeling absolutely terrible – fatigue, brain fog, cold hands and feet, hair falling out. The real story was in my T3/reverse T3 ratio, which was only 7 when optimal is above 20. That’s severe conversion dysfunction that TSH completely missed.
Here’s what you need beyond basic:
- TSH, Free T4 and Free T3
- As a secondary test you should request Reverse T3 for conversion assessment
- Thyroid antibodies (TPO and Thyroglobulin) to check for autoimmune involvement.
And if you’re already taking T3 medication, don’t panic when your TSH is suppressed – that’s completely normal and expected. Most doctors understand this now, but some still freak out when they see low TSH in T3-treated patients.
Metabolic Health (for weight resistance, energy crashes, pre-diabetes concerns)
The HOMA-IR calculation was a game-changer for understanding my metabolic dysfunction. It’s actually pretty simple math – you multiply your fasting glucose by your fasting insulin, then divide by 4052. But what it reveals is so much more powerful than looking at glucose or insulin alone.
Here’s the thing most people don’t realize: you can have completely “normal” glucose while your insulin is working overtime to keep it that way. That’s early insulin resistance, and it’s invisible if you only check glucose. On the flip side, you might have high glucose with normal insulin, which means your pancreas is starting to burn out from years of overwork.
My own progression tells the whole story. Back in 2013, my HOMA-IR was probably around 0.7 – excellent metabolic health. But by 2022, despite years of extreme dieting and exercise, it had climbed to 6.4, putting me in the severely insulin resistant category. Even now in 2025, after three years of GLP-1 therapy, I’m still at 3.9. That explains why every weight loss attempt felt like pushing a boulder uphill.
The ranges that matter4:
- Optimal: <1.0
- Early resistance: 1.0-2.5
- Insulin resistant: >2.5
- Severely resistant: >5.0
Don’t let your doctor dismiss insulin testing just because your glucose looks fine – you’re missing half the metabolic picture without it.
My Progression:
- 2013: HOMA-IR ~0.7 (excellent)
- 2022: HOMA-IR 6.4 (severely resistant)
- 2025: HOMA-IR 3.9 (improved but still resistant)
Part 2: Red Flag Patterns to Watch
When “Normal” Labs Hide Serious Problems
The biggest challenge with lab interpretation isn’t getting abnormal results – it’s recognizing when “normal” results don’t match your clinical reality. Here’s what AI taught me to watch for:
Time-dependent ranges create blind spots. My cortisol values sat in patient portals for months without flags because the automated systems didn’t correlate collection times with appropriate reference ranges. Even worse, some labs use general ranges that don’t account for circadian rhythms at all.
Reference ranges reflect sick populations, not optimal health. When labs establish “normal” ranges, they’re often based on the average of everyone getting tested – including people with undiagnosed conditions. This means you can be in the “normal” range while still having significant dysfunction.
Multi-System Pattern Recognition
Traditional medicine evaluates each lab in isolation, but AI excels at spotting connections across multiple systems. In my case, when cross-referenced with my genetics, these seemingly separate problems were actually interconnected:
The cortisol-insulin connection: Low cortisol impaired my body’s ability to handle stress, including the metabolic stress of blood sugar regulation. This contributed to insulin resistance that persisted despite extreme dietary interventions.
Thyroid conversion cascades: Poor T4-to-T3 conversion affected every metabolic process, including glucose metabolism and stress hormone production. Optimizing thyroid conversion became essential for addressing the other hormone imbalances.
Inflammation feedback loops: Chronic low-grade inflammation interfered with nutrient absorption, creating deficiency cycles that perpetuated the metabolic dysfunction.
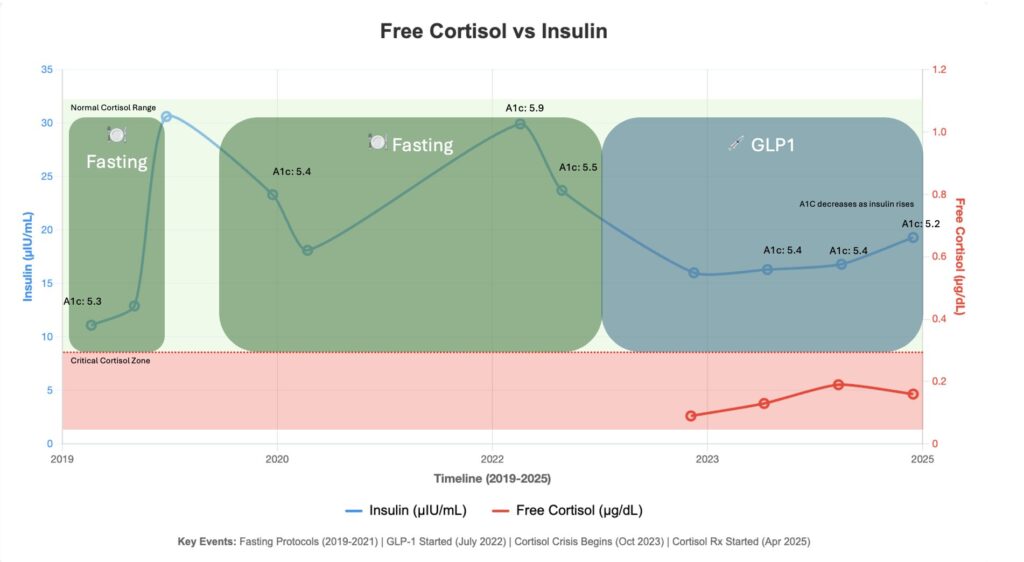
This dual-axis chart tracks insulin (blue) and free cortisol (red) over time, revealing how low cortisol masked insulin resistance by keeping A1c normal despite high insulin levels—a pattern only visible when charting multiple biomarkers together.
The Paradox Patterns
Some of the most important red flags appear as contradictions – high levels that should be good but aren’t, or normal values that don’t match symptoms.
My B12 paradox is a perfect example: serum B12 at 1873 pg/mL looked great on paper, but I had severe symptoms of B12 deficiency. When AI cross-referenced this with my genetics, it identified the MTR gene variant (rs1805087) that reduces methionine synthase efficiency by 35-50%¹ – explaining the high serum levels with poor cellular utilization. Traditional medicine would have dismissed B12 deficiency based on the high serum level alone.
Part 3: Quick Reference Guide
Once you have your lab results, you need to know what to look for beyond the simple “normal” or “abnormal” flags. This section provides the key ratios, optimal ranges, and red flag values that can reveal dysfunction even when individual tests appear normal. Think of these as your cheat sheet for spotting patterns that conventional interpretation might miss.
Critical Lab Ratios
- T3/rT3: >20 optimal
- Triglycerides/HDL: <2.0 optimal
- HOMA-IR: <1.0 optimal
Optimal Ranges (Functional vs. Reference)
- TSH: Reference 0.5-5.0, Functional 1.0-2.5 5
- Vitamin D: Reference >30, Optimal 50-70 ng/mL
- Ferritin: Reference varies widely, Optimal 50-150 ng/mL
Red Flag Values
- Morning cortisol <0.20 µg/dL
- T3/rT3 ratio <15 (poor thyroid conversion)
- Fasting insulin >15 µIU/mL
- HOMA-IR >2.5
- hs-CRP >3.0 mg/L
- eGFR declining >3 mL/min/1.73m² per year (kidney function deterioration)
Part 4: Working with Your Doctor
The relationship with your healthcare provider should be collaborative, not adversarial. You live in your body 24/7 – you know when something feels wrong, when treatments aren’t working, and when you’re not getting better. A good doctor will listen to your observations, take your concerns seriously, and work with you to find answers. If your doctor dismisses your symptoms, refuses to investigate patterns you’ve identified, or makes you feel like you’re being dramatic, it’s time to find a new doctor. Good doctors do exist, and you deserve one who respects your experience and partners with you in your health journey.
That said, doctors can only work with the information you provide. Brain fog, appointment anxiety, time constraints, and chronic illness fatigue all make it hard to communicate effectively. After feeling bad for so long, I lost my reference point for what “good” was supposed to feel like. I dismissed many symptoms because I didn’t want to seem like a hypochondriac. This is why creating a written summary before appointments is so powerful – it ensures you don’t forget important details and gives your doctor the complete picture. AI helped me organize and articulate my complex medical history in a way that was clear and comprehensive.

Present Information Professionally
- “I’ve been tracking patterns and noticed…”
- “Research suggests these values might indicate…”
- “Could we consider testing for…”
Request Specific Tests
- Provide rationale from symptoms and research
- Ask for comprehensive panels, not single tests
- Request trend monitoring over time
Build Your Lab Timeline
Download Our Lab Tracking Template: Lab Tracker Spreadsheet – Pre-formatted with columns for all essential data points. You can use the data to chart your trends manually, or check out my AI Tools guide to learn how to ask AI to create charts and analyze patterns for you.
Essential tracking elements:
- Date of collection
- Test name and result
- Reference range used
- Symptoms at time of collection
- Current medications and doses
- Major life events or stressors
- Treatment changes and responses
Make it visual: Once you have 6+ months of data, create a trend chart or upload your completed spreadsheet to AI and let it create the chart.
This approach helped me spot the progressive cortisol decline and insulin resistance development that individual lab reviews had missed. Early in my journey, when I thought thyroid was my only problem, tracking helped me correlate rising reverse T3 levels with periods of weight gain – revealing the conversion dysfunction pattern that led to T3 therapy.
Success Metrics: Tracking Your Progress
Lab numbers tell only part of the story. Real success means feeling better, having more energy, and reclaiming your quality of life. While you’re working toward optimal lab values, don’t lose sight of the functional improvements that matter most in daily life.
Functional Improvements Matter Most
Track how you feel day-to-day, not just what labs show quarterly. I started noticing energy improvements within days of starting hydrocortisone, long before my next lab draw. Quality of life metrics often improve before lab values normalize.
Energy and function indicators:
- Consistent energy throughout the day (no 3pm crashes)
- Exercise tolerance and recovery (can you walk upstairs without getting winded?)
- Sleep quality and feeling rested upon waking
- Mental clarity and ability to focus on complex tasks
- Temperature regulation (no longer freezing in summer or overheating easily)
References:
- Leclerc D, et al. Human methionine synthase: cDNA cloning and identification of mutations in patients with megaloblastic anemia. Proc Natl Acad Sci USA. 1996;93(4):1475-1479. PMID: 8643654
- Matthews DR, et al. Homeostasis model assessment: insulin resistance and β-cell function from fasting plasma glucose and insulin concentrations in man. Diabetologia. 1985;28(7):412-419. PMID: 3899825
- Hellhammer DH, et al. Salivary cortisol as a biomarker in stress research. Psychoneuroendocrinology. 2009;34(2):163-171. PMID: 19095358
- Stern SE, et al. Identification of individuals with insulin resistance using routine clinical measurements. Diabetes. 2005;54(2):333-339. PMID: 15677489
- Wartofsky L, Dickey RA. The evidence for a narrower thyrotropin reference range is compelling. J Clin Endocrinol Metab. 2005;90(9):5483-5488. PMID: 16148345
Ready to become your own health advocate? Follow my weekly updates for practical tutorials and ongoing insights.